Products
Relationship maps
One method for understanding a topic through who is connected to whom. I built it three times, each for its own question.
A relationship map shows the people or companies around a topic and how they connect. Every node and every link has a source behind it. The scores sit in the open, so the ranking can be re-weighted instead of trusted blind. I built it first as KOL Atlas, to read a market before a launch. Then as Ocean inside Orca, to decide which companies to reach and through whom. Then as a demo product for a website build.
- Year
- 2026
- Role
- Creator
- Type
- Network maps · research
- Maps
- KOL Atlas · Ocean · a demo
- 1,672
- links between 656 nodes in KOL Atlas, each with a source
- 2,000
- companies and 300 partners on Ocean's map, a frame in 1 to 2 ms
- 3
- maps, one method
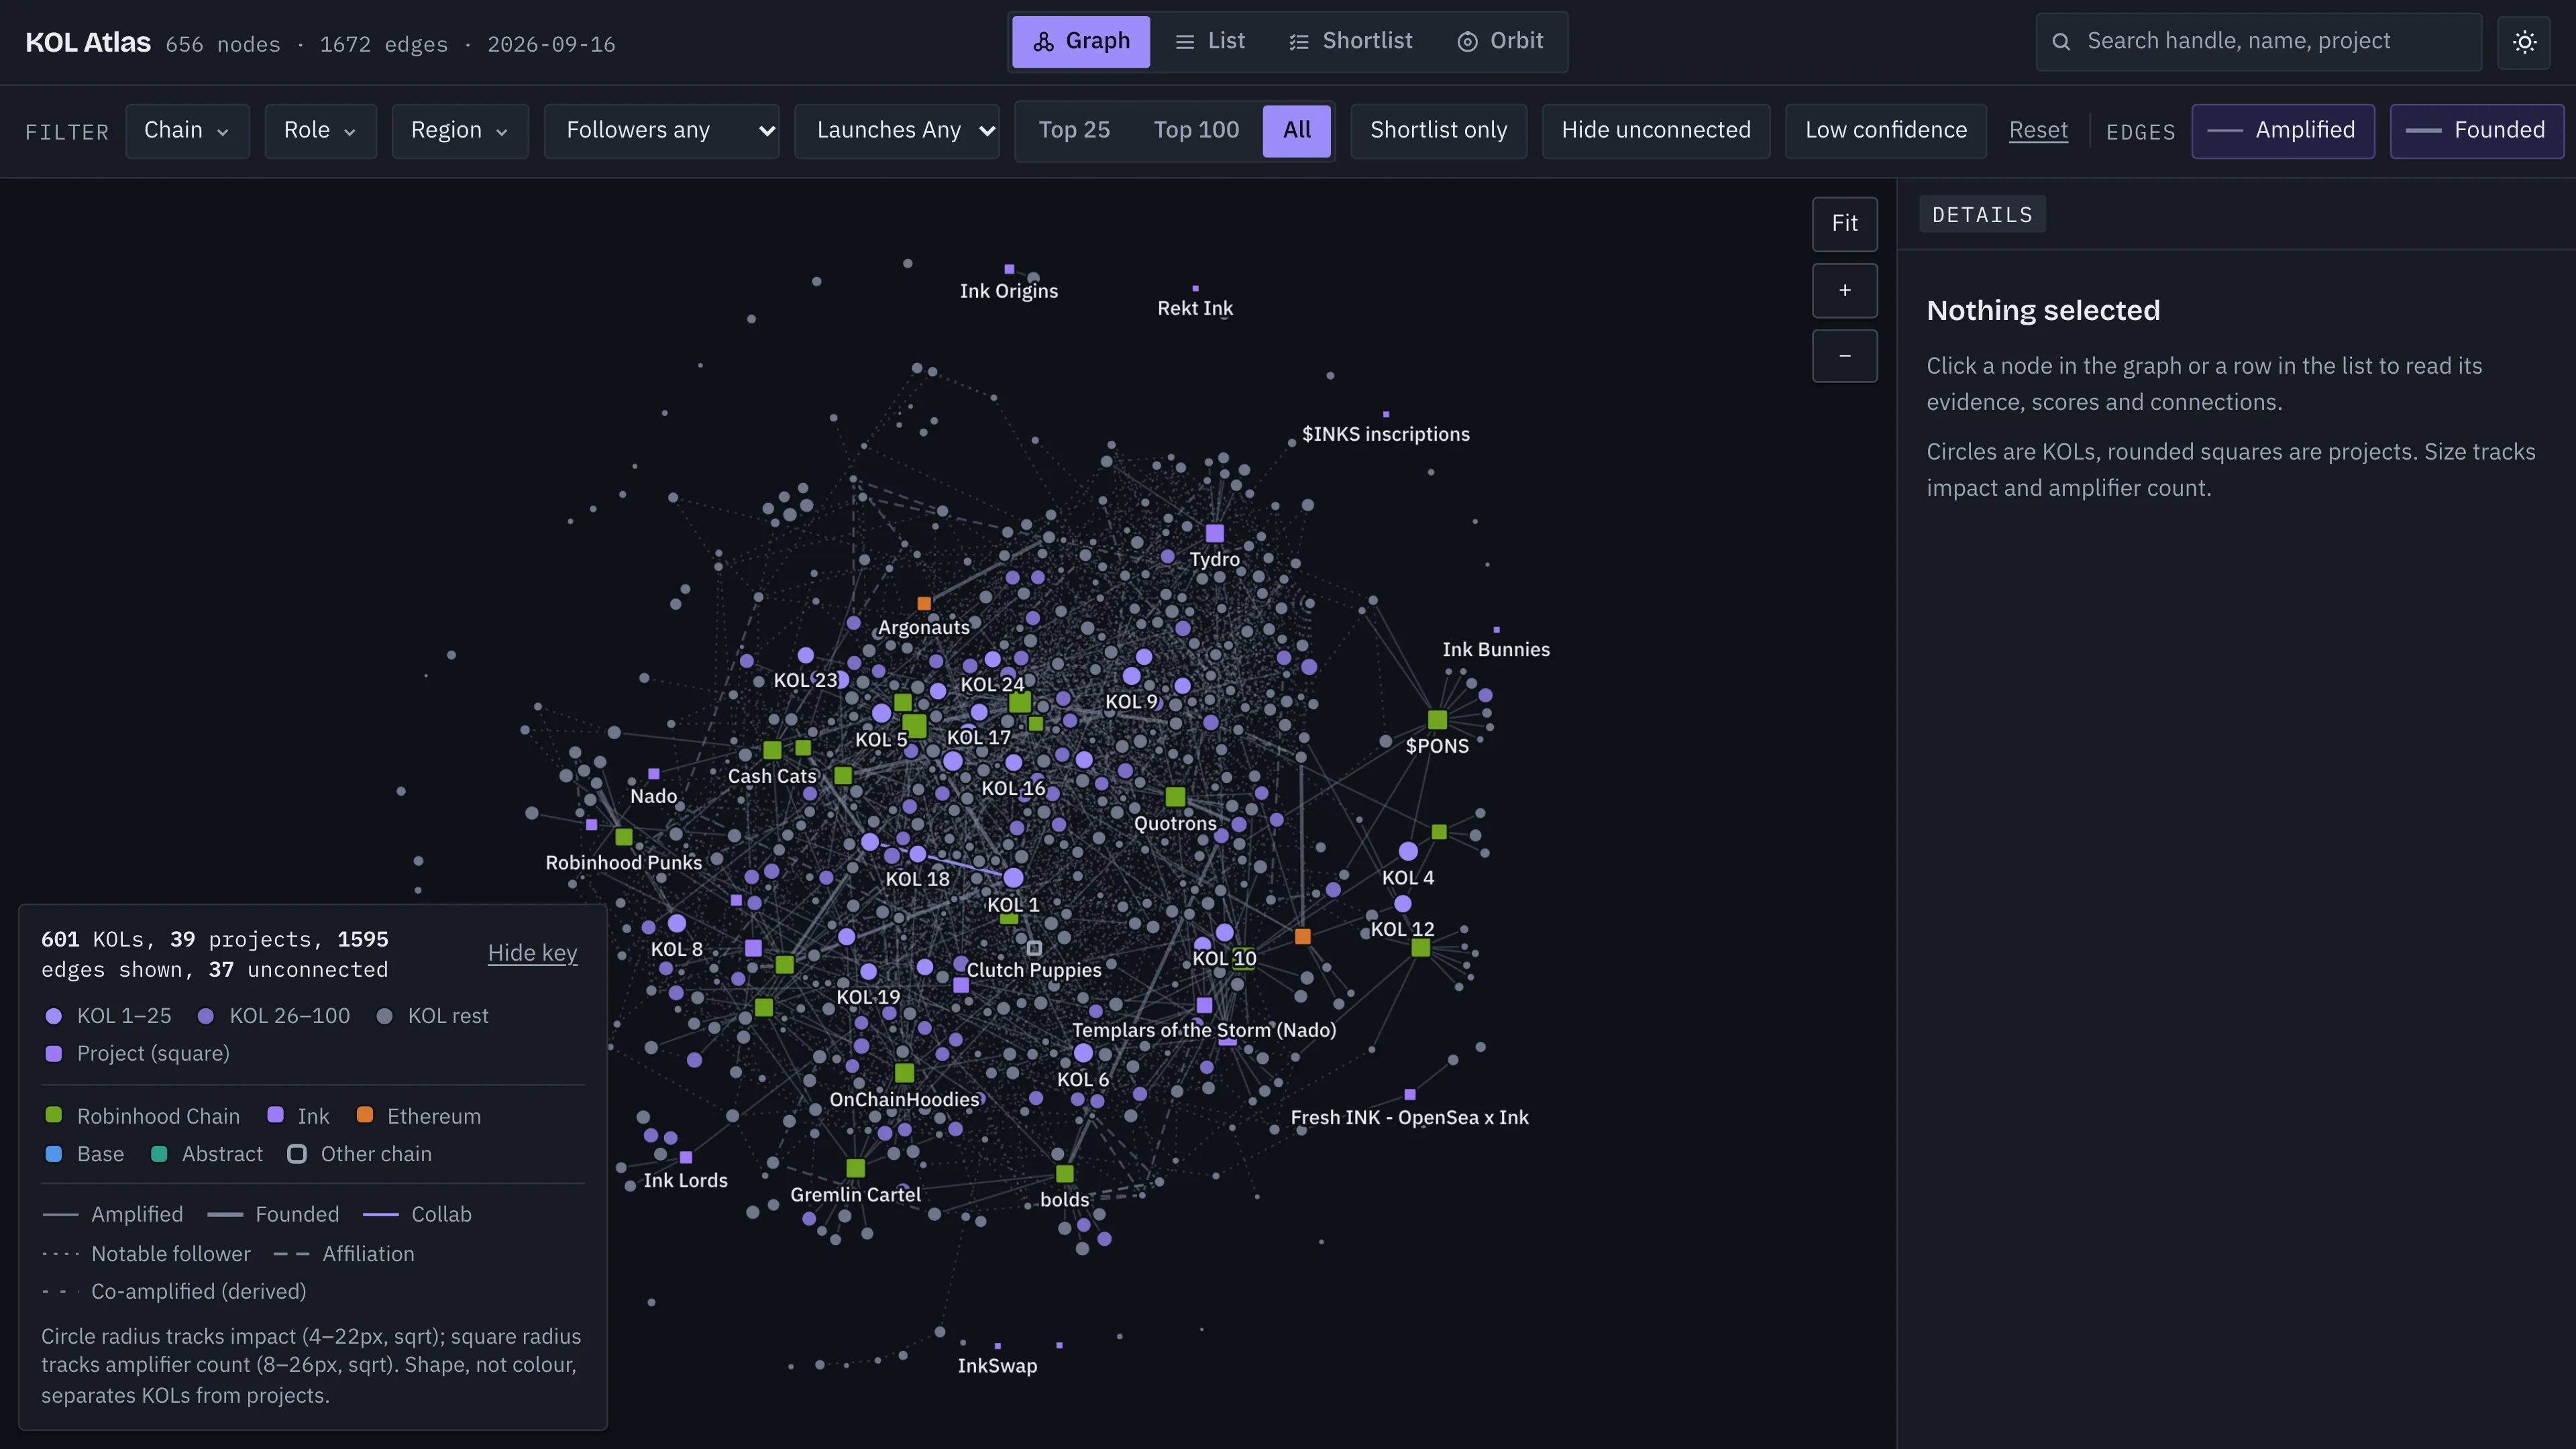
Every link has a source. Every score is in the open.
Each map follows the same rules. Every node and every link carries a source. No source, no claim. Scores are split into parts you can see and the weights can be changed. Tiers are computed from the evidence; manual judgement lives in its own record. Every view can also show as a list. The map shows the shape. The list lets you check it.
Read a market before contacting anyone in it.
Before a launch I wanted to understand its corner of the market: who amplified recent launches, how they relate and who matters. A team of research agents gathered it under hard rules. Read-only, a source URL on every claim, only public professional details and nobody contacted. The result is 656 nodes and 1,672 links. Impact weighs reach, relevance, centrality, recency and referral fit. Every part shows. Four views read it differently: Graph, List, Shortlist and Orbit.
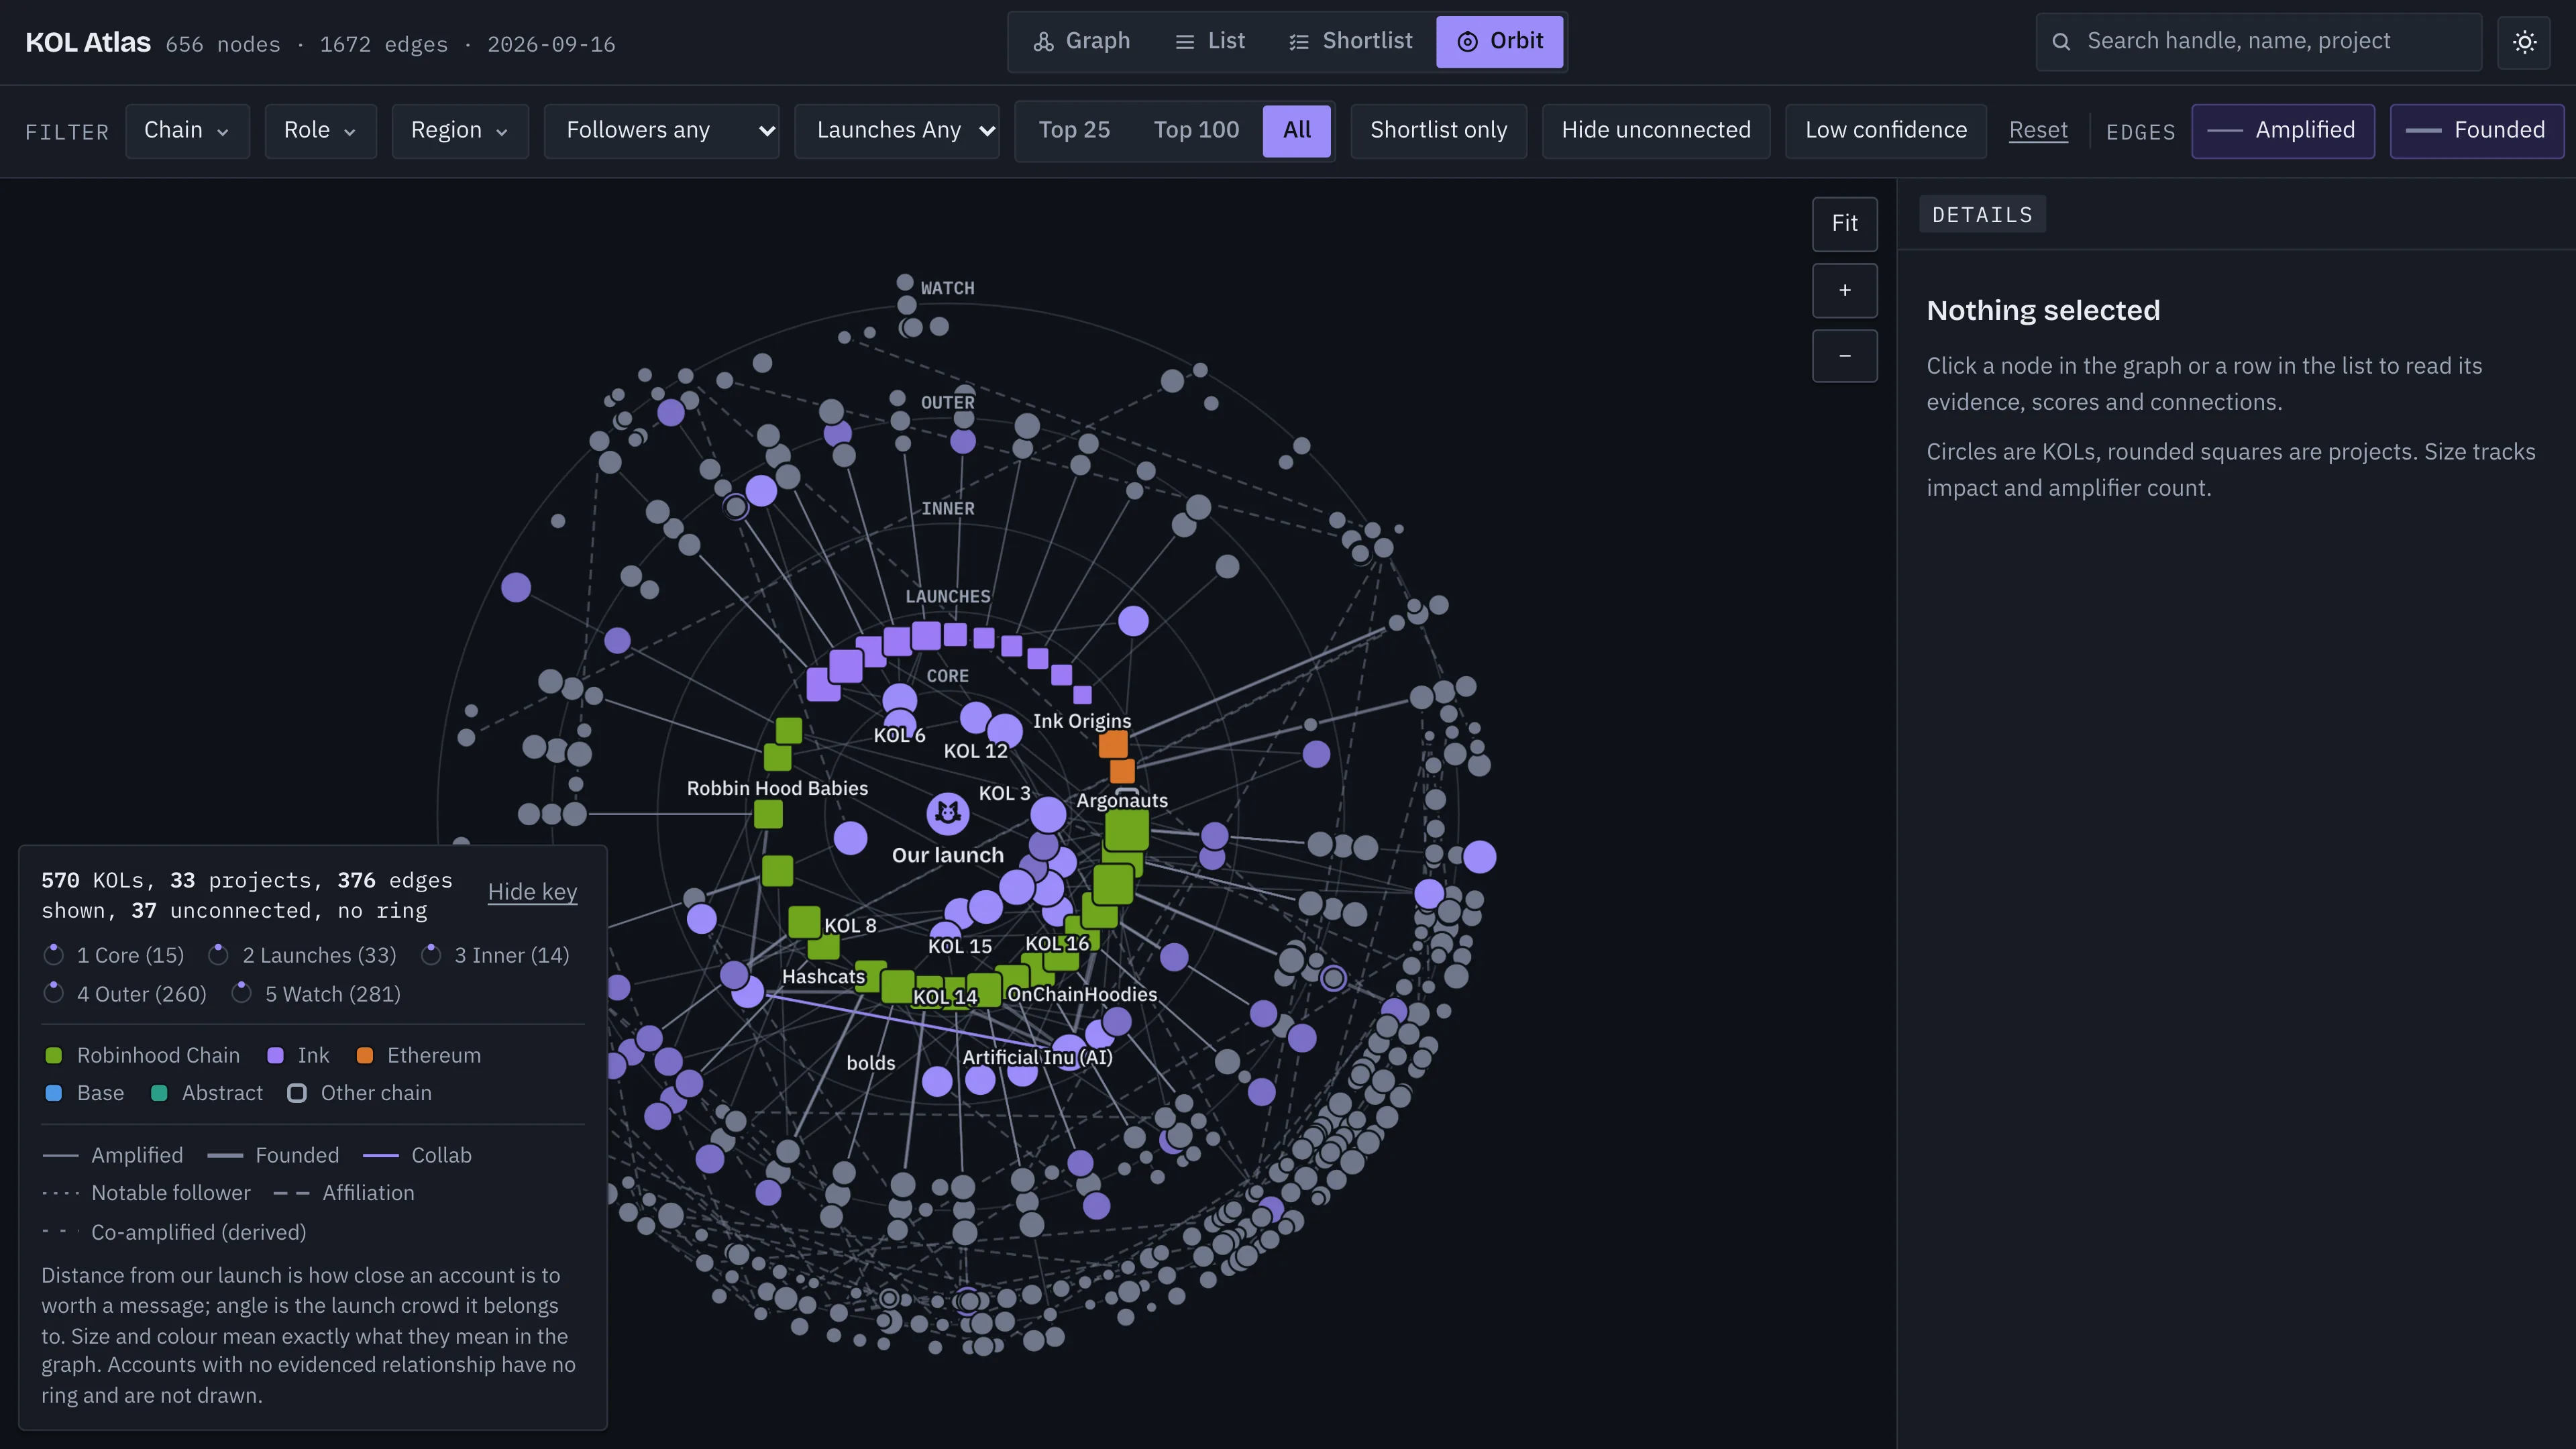
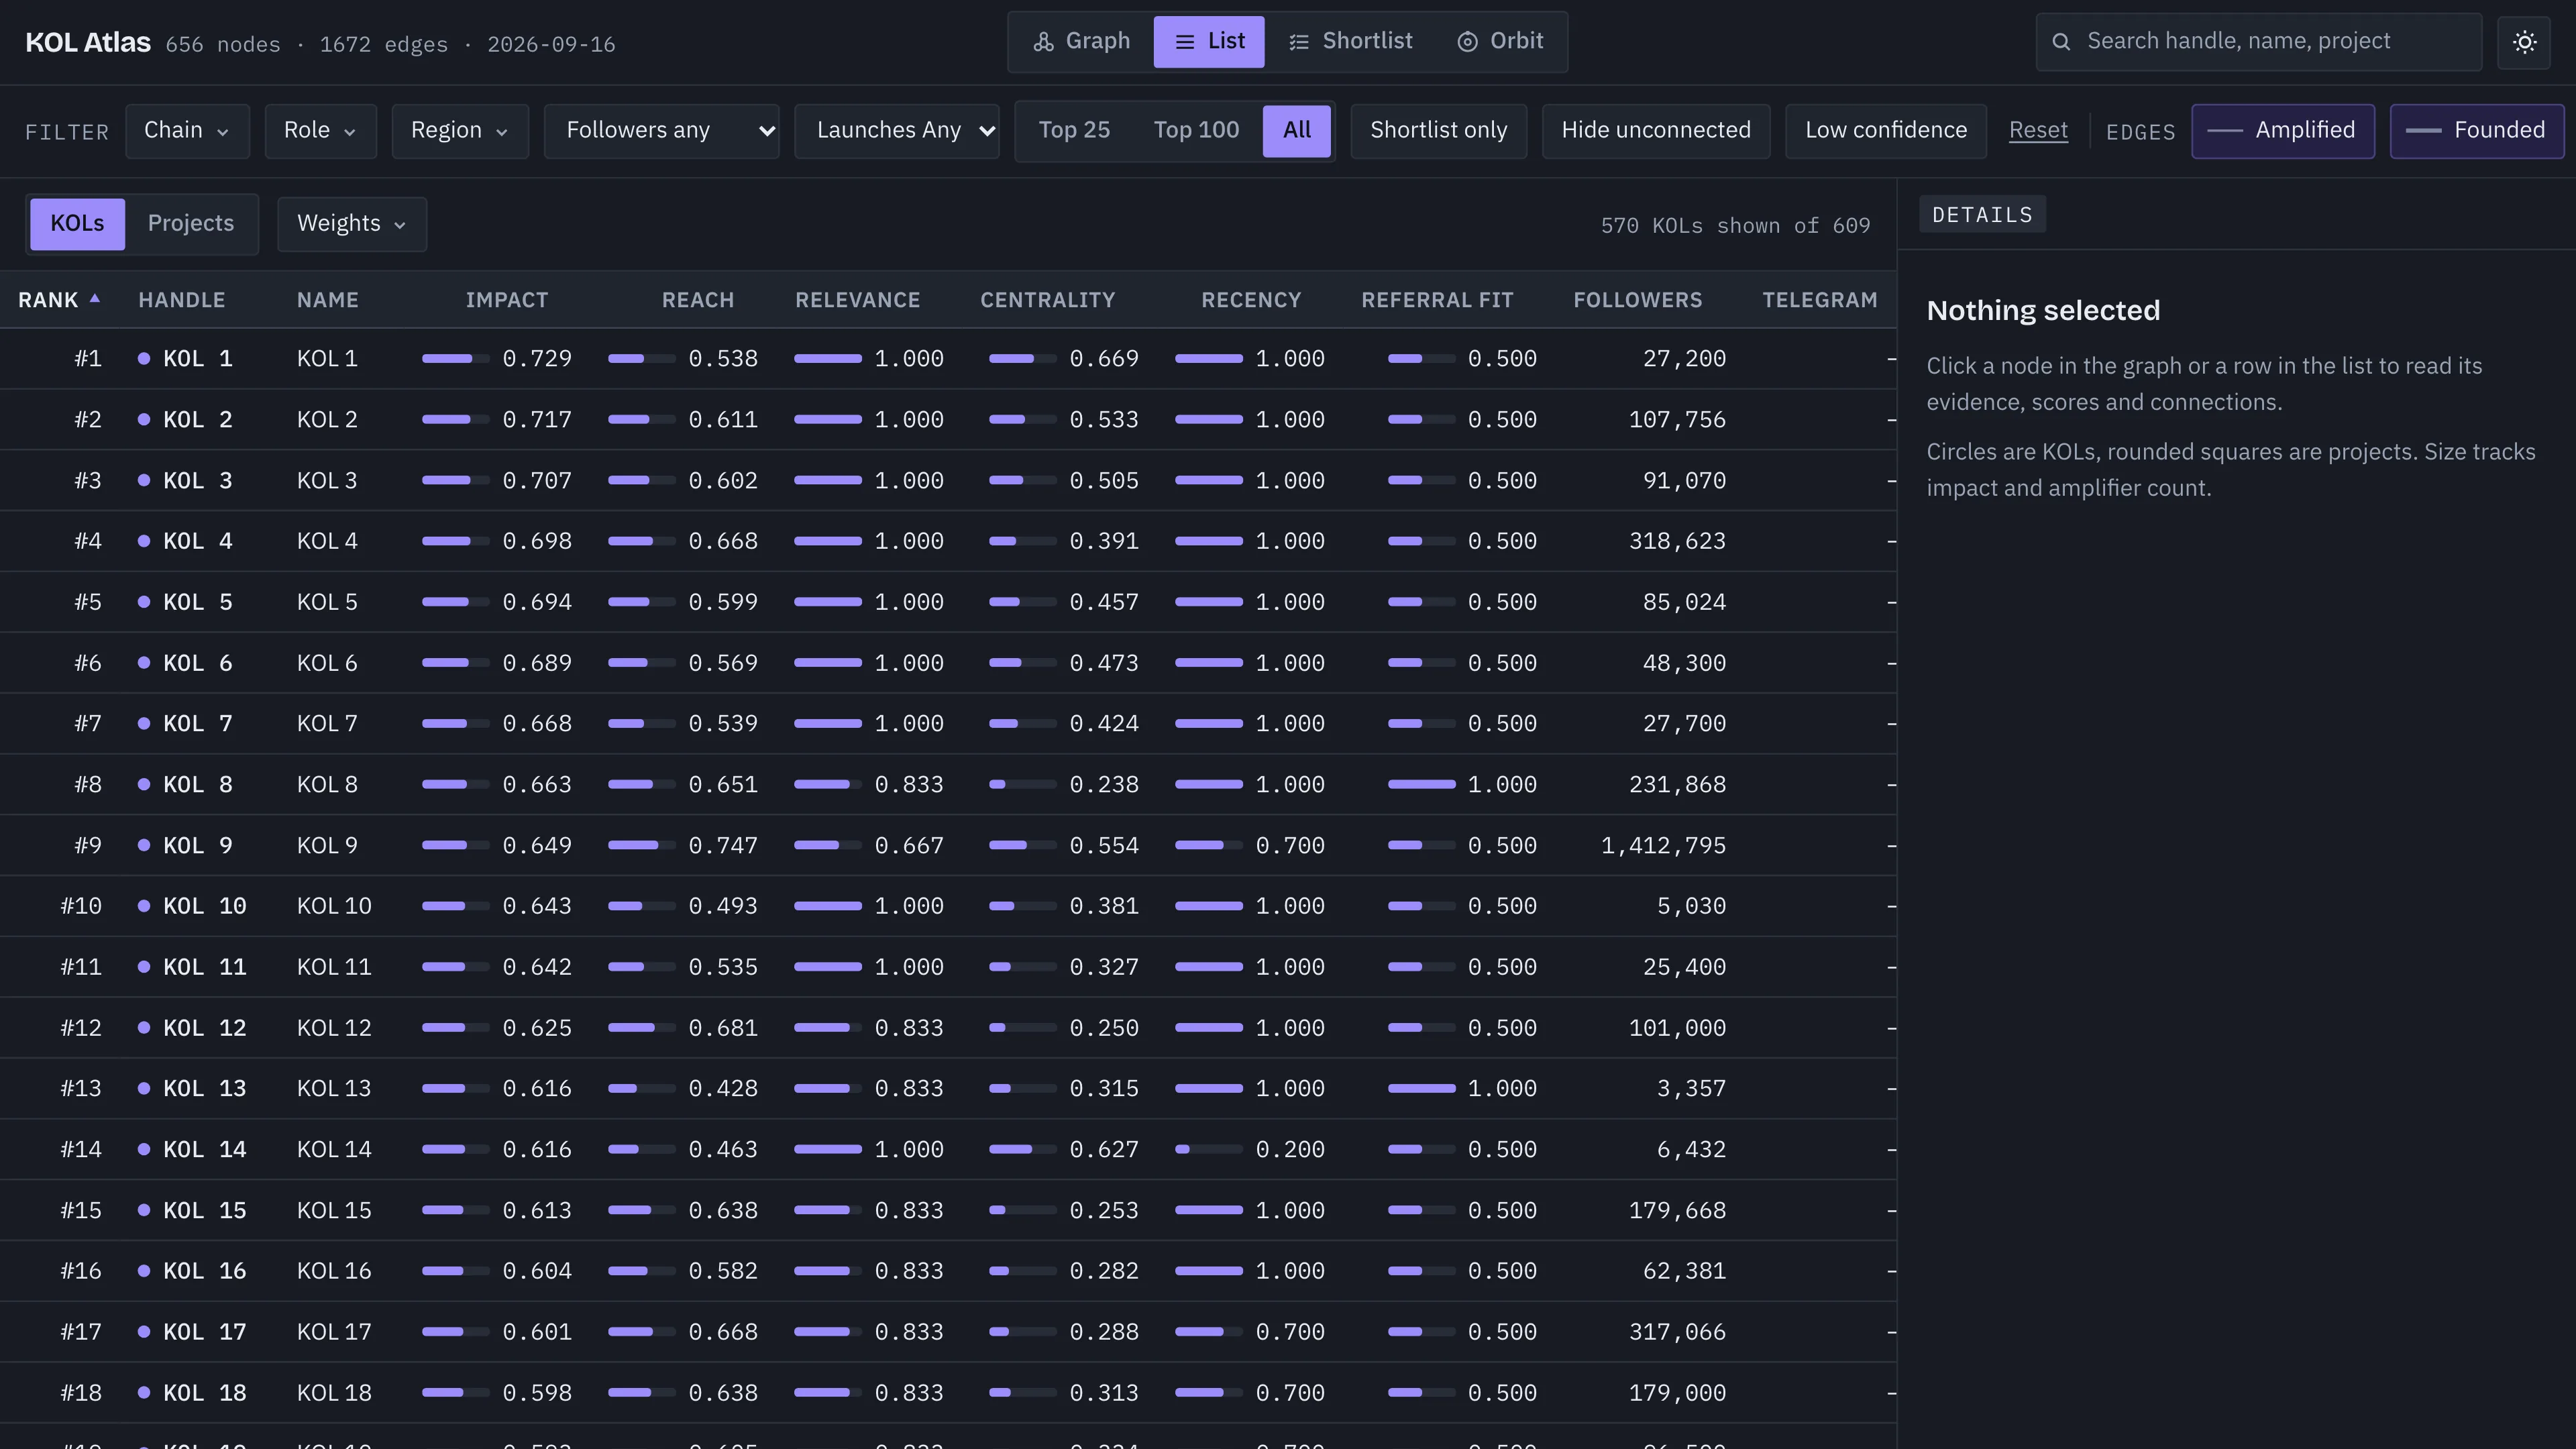
No single voice carried the wave.
Read launch by launch, no account amplified more than two of 13 launches. Attention came from a studio behind several of them, founders with an old following and many mid-size accounts. Ranking by reach alone would have missed that. So the composite score lifts studio and newsletter accounts above pure follower counts. The chain colours were checked for colour blindness. Shape and line style carry the same information too.
The same method, pointed at companies.
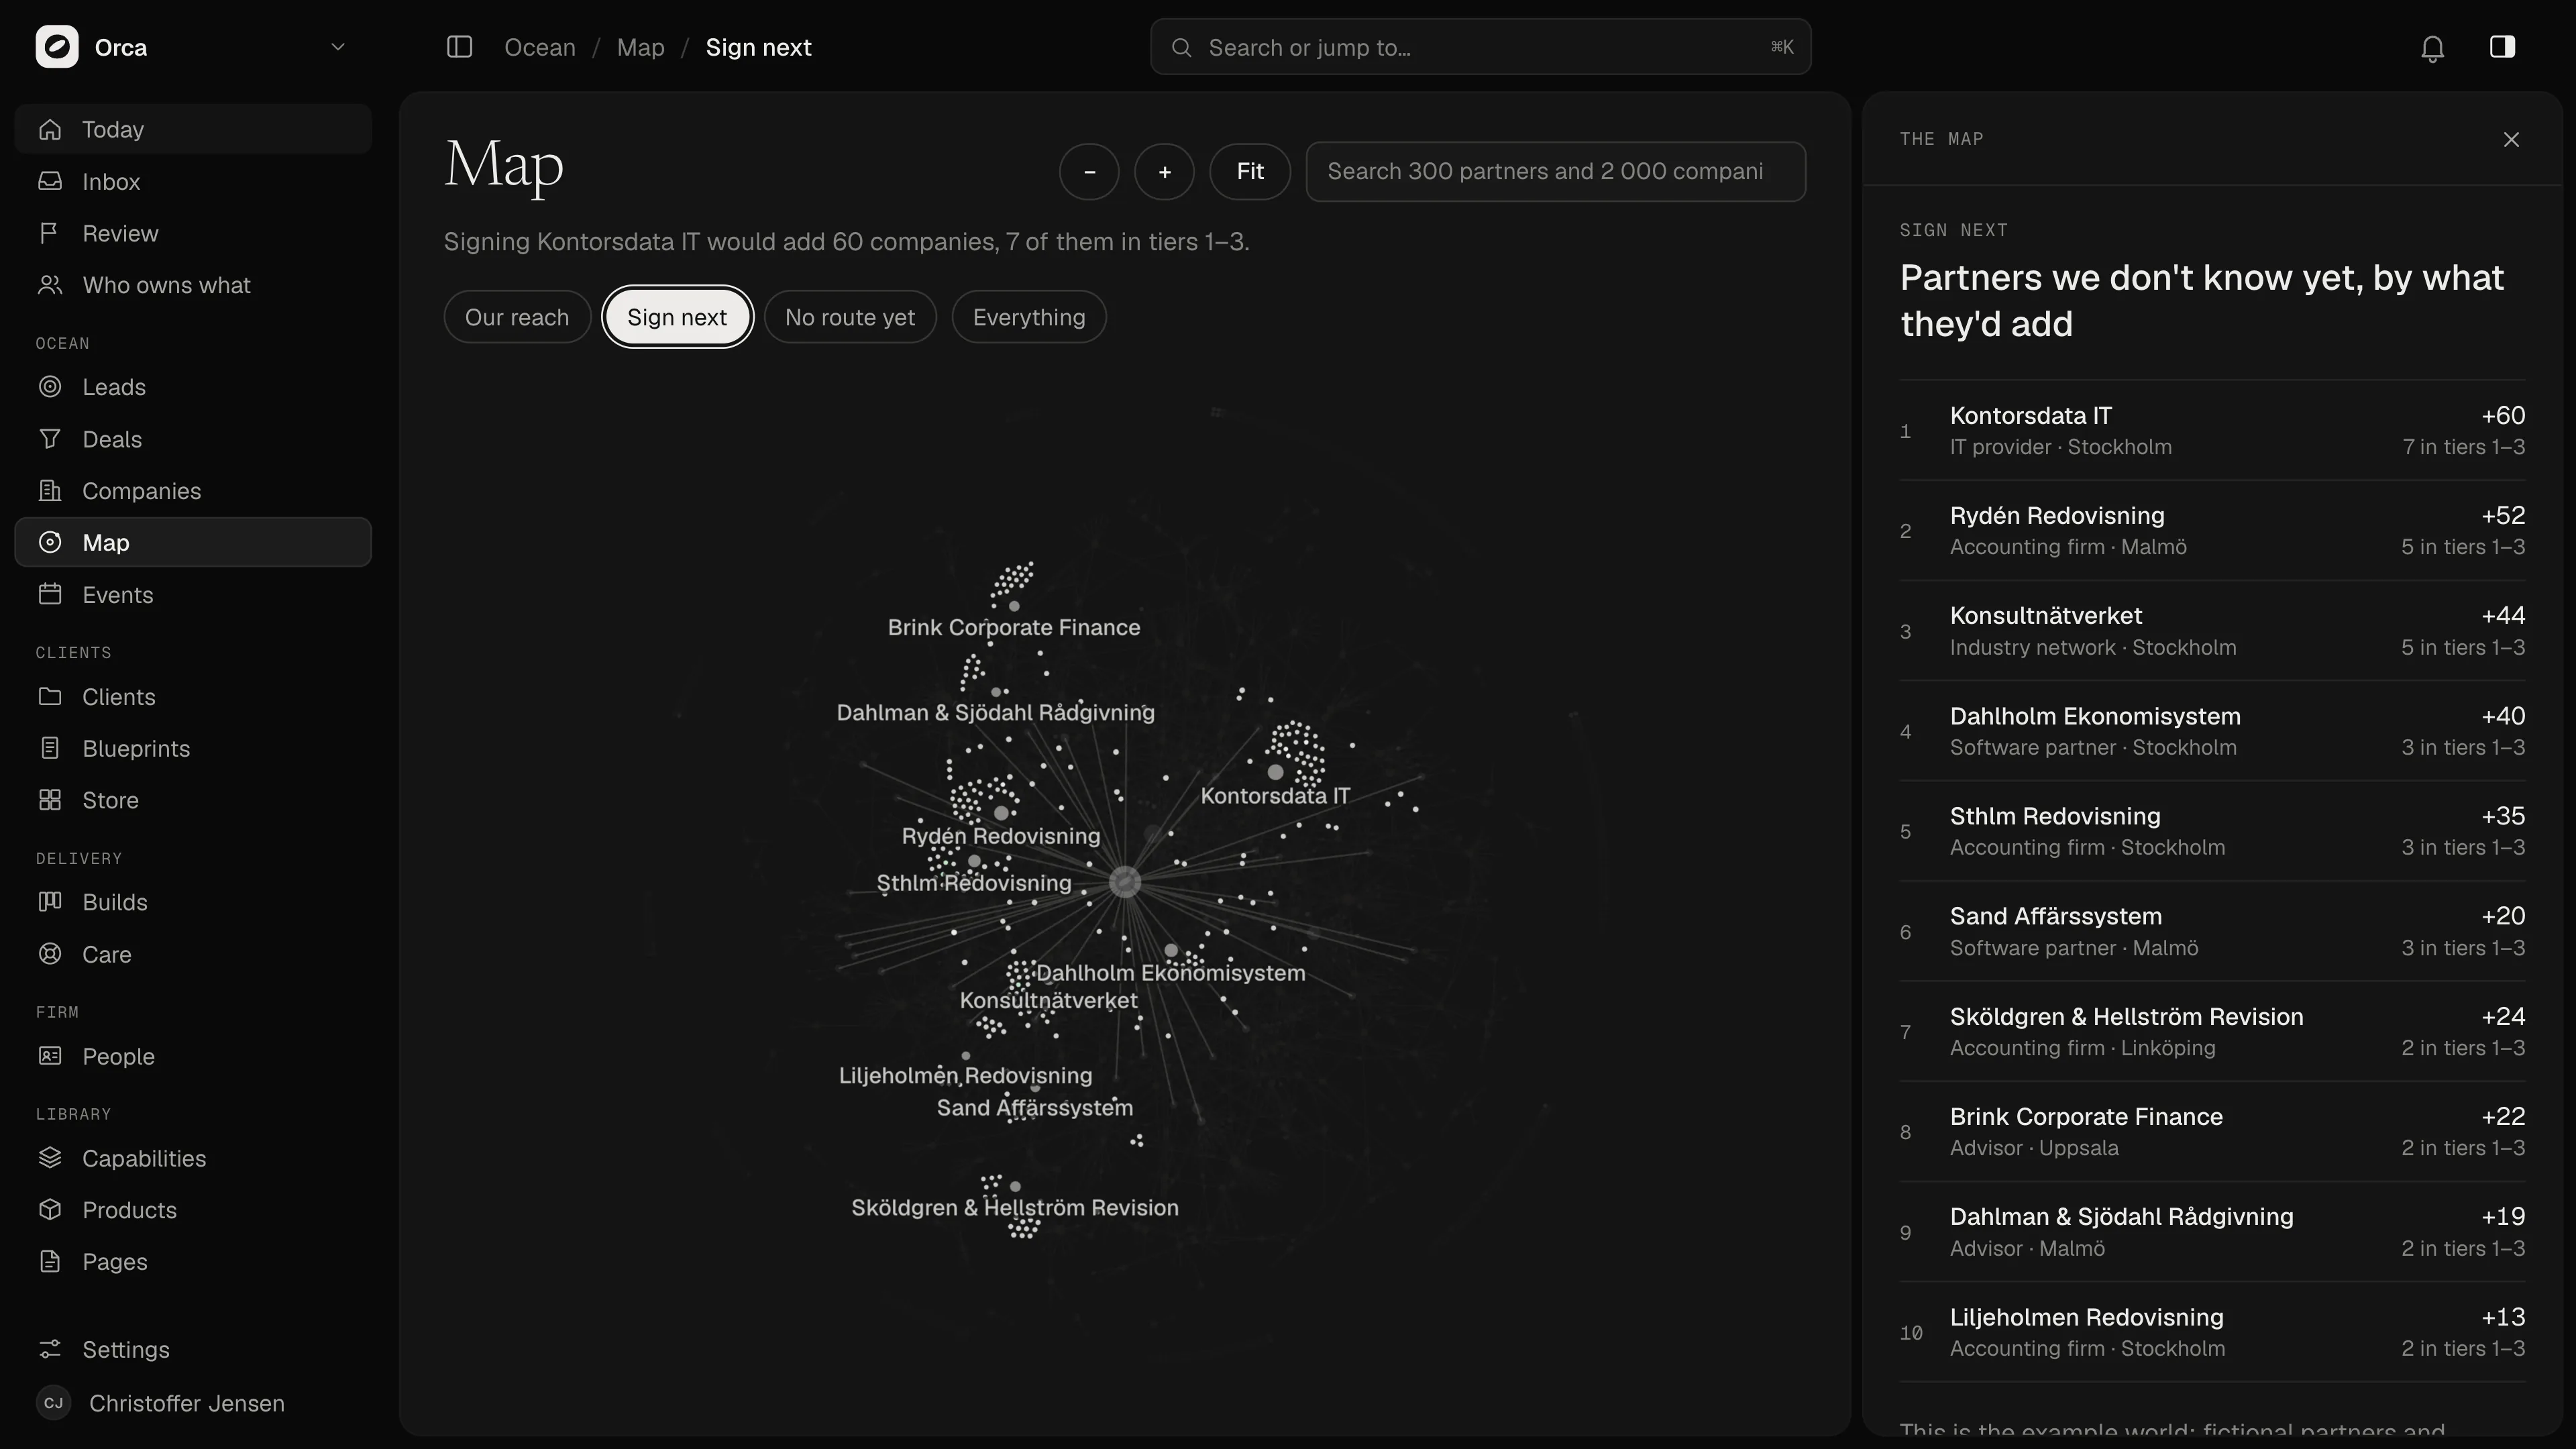
Ocean is the method applied to companies, in Orca’s own sales tool. It adds time, sales status and legal rules for people and channels. A vendor’s price rise or end of support has a date, so a company’s score rises as the date nears. The map puts Orca in the middle, the partners we know around it and the companies they advise beyond. It opens on a question: our reach, who to sign next, who has no route yet. The answer is the page’s first line.
From hundreds of nodes to thousands, then to the morning's moves.
KOL Atlas draws about 650 nodes on a canvas. Ocean’s example world has 300 partners and 2,000 companies. A frame draws in one to two milliseconds. The simulation settles in a Web Worker, so the page never waits on it. The layout is checked before it is drawn: every node placed, no two overlapping. A map that fails the check is not drawn. Then the map stops being the destination. What it finds becomes the morning’s moves in Today, each with its reason and its route.
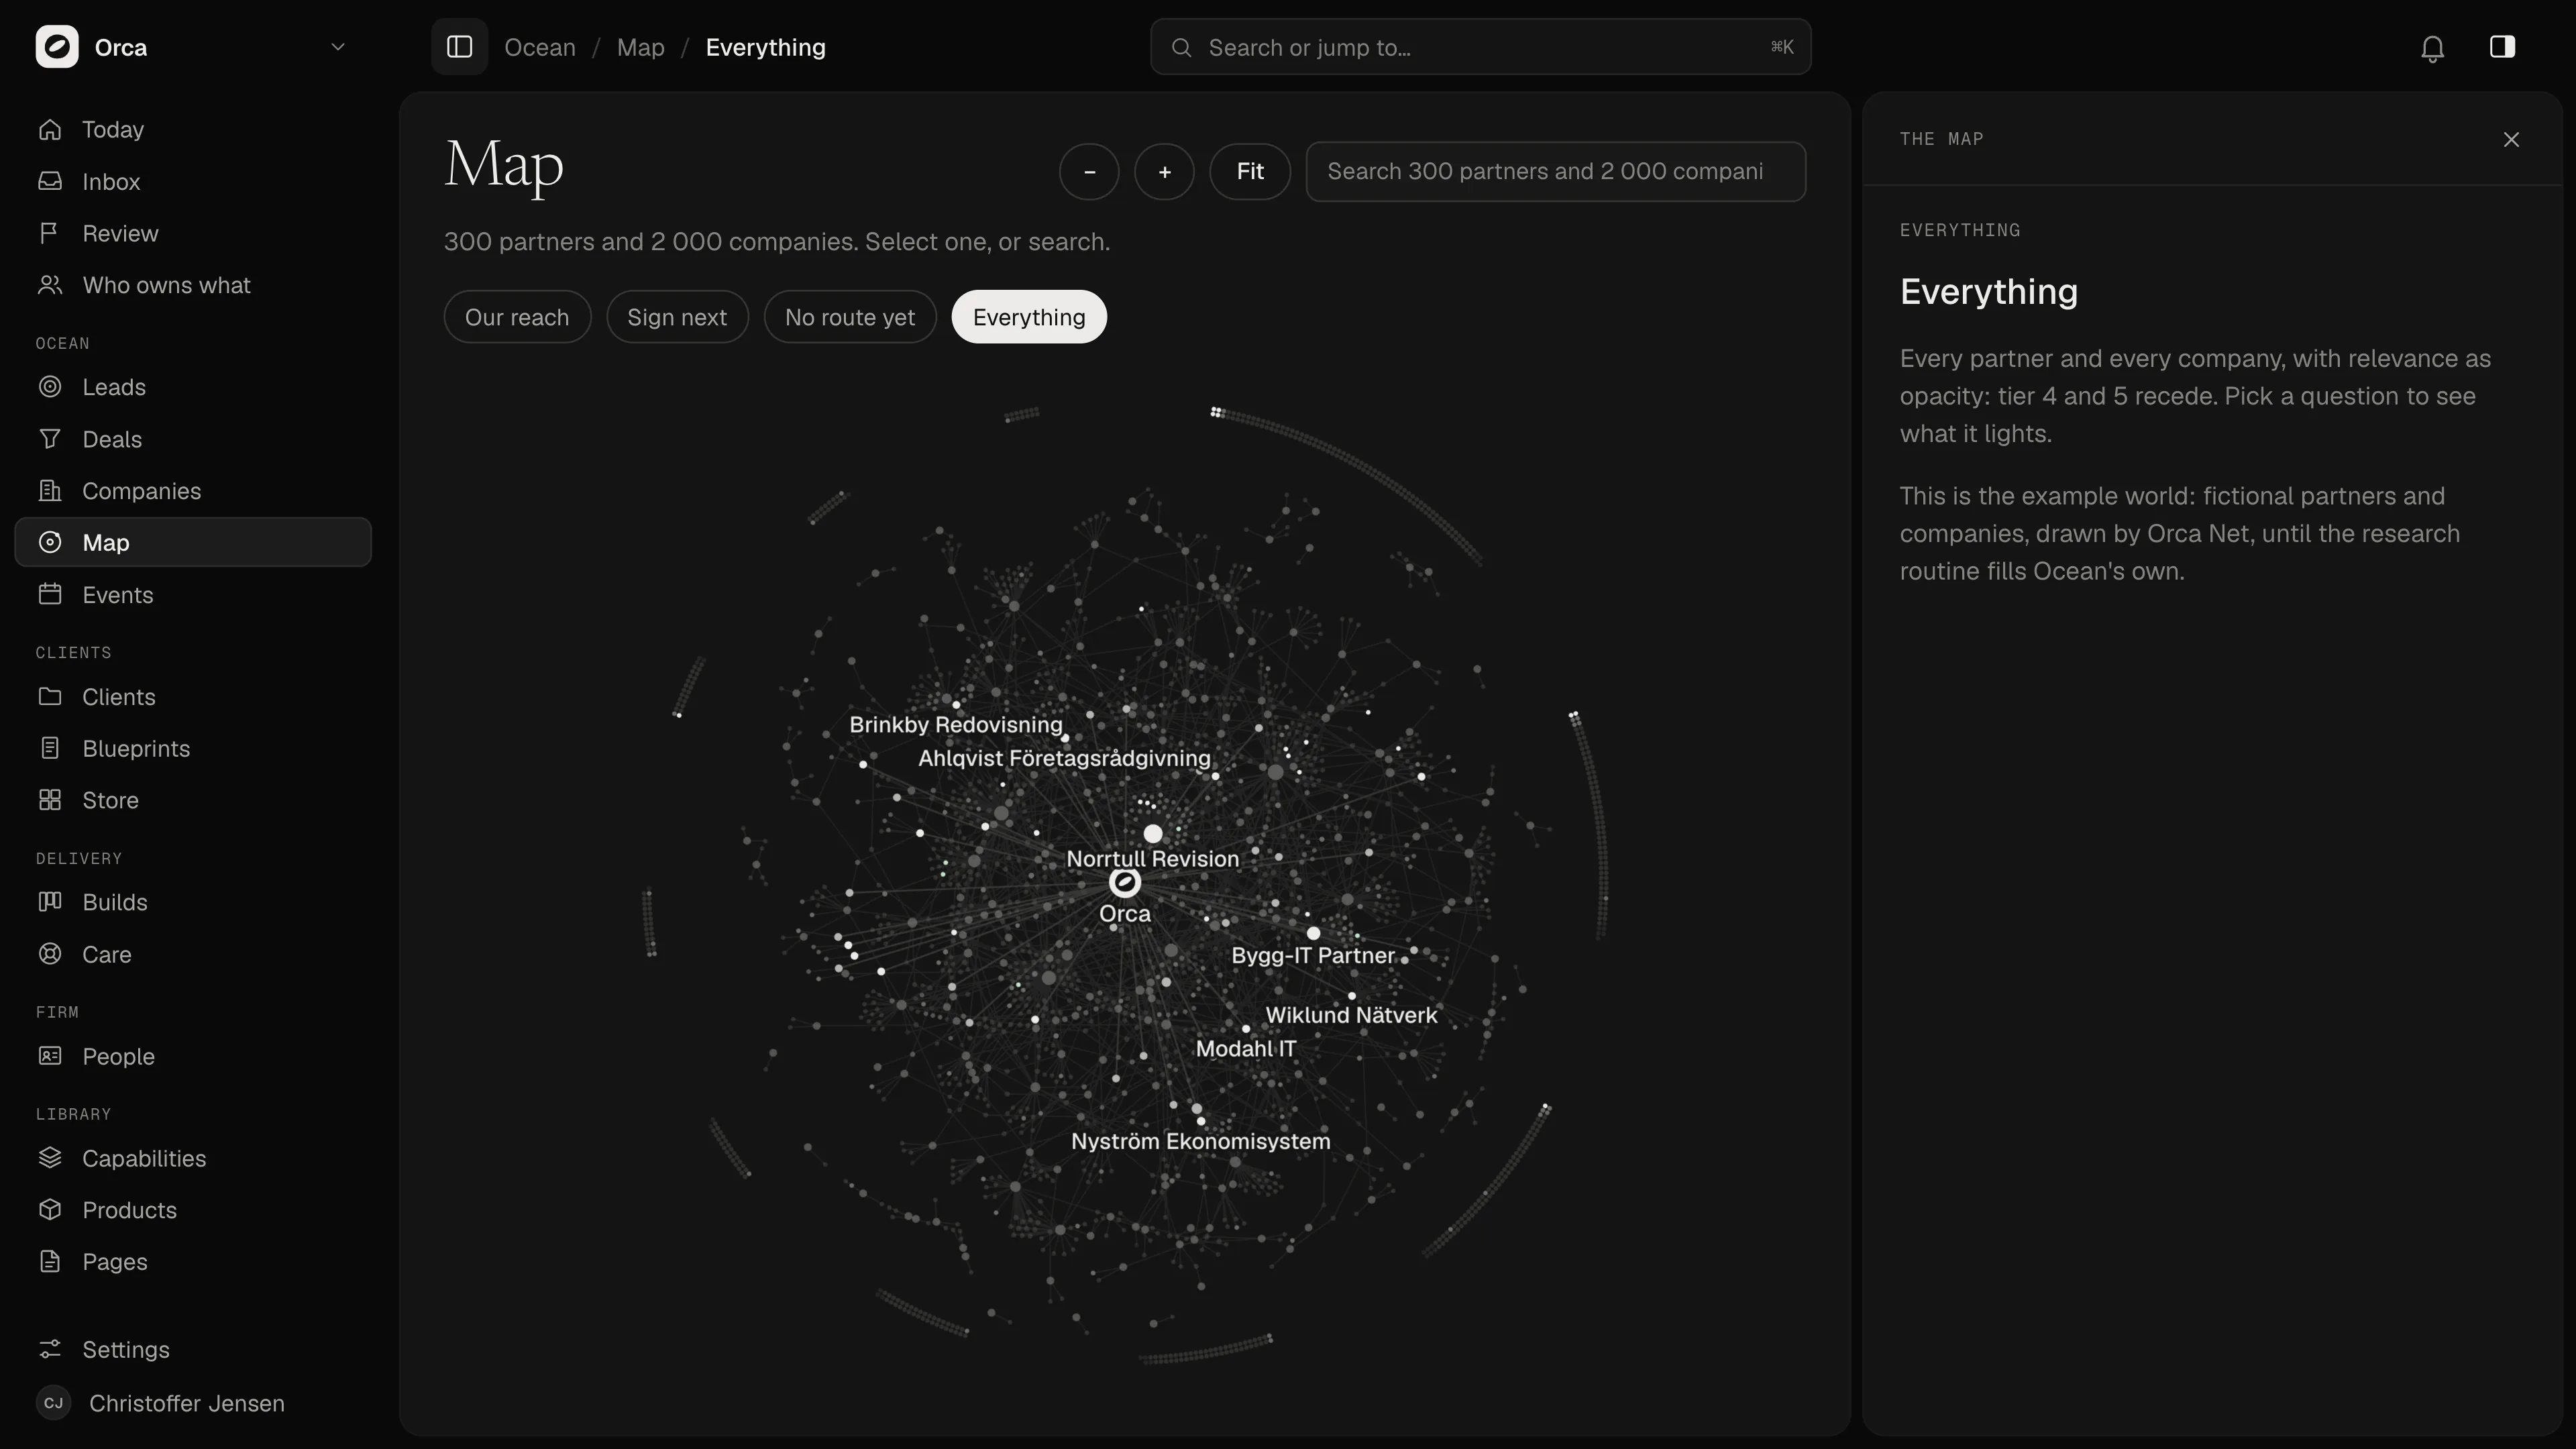
The method, packaged for a buyer.
For a website build I made the same idea into a demo product. A map of fictional companies, today’s six moves, the evidence behind each and a warm path through people you already know. The introduction it drafts is marked not sent. A person sends it.
What carried across: the question decides the map. KOL Atlas asked who matters in a market. Ocean asks who to reach and through whom. The demo asks what to do this morning. The rules stayed the same: a source on every link, scores in the open and a person who decides.
Creator: the method, the research rules, the scoring, the three maps and their design. The research ran through agents I directed.
Next
Kvitta